TL;DR
- The hypothesis: a small model fine-tuned for one narrow decision can beat large, expensive, general-purpose models at that decision.
- The decision: given several comparable ads, which one will get the most clicks? It’s judged on the creative alone, before launch.
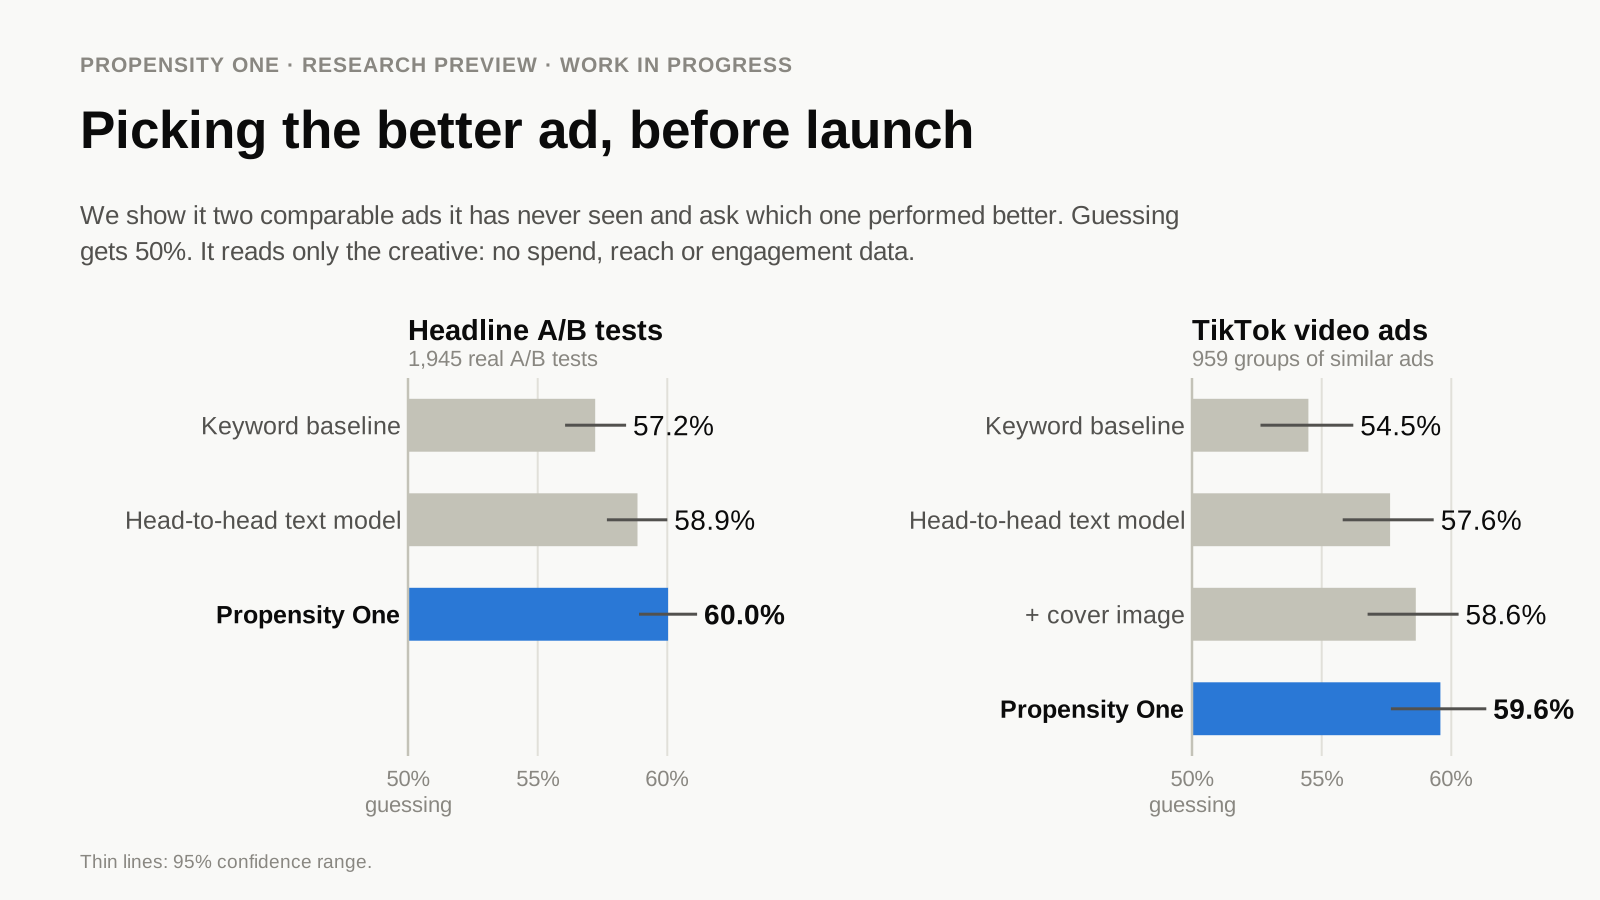
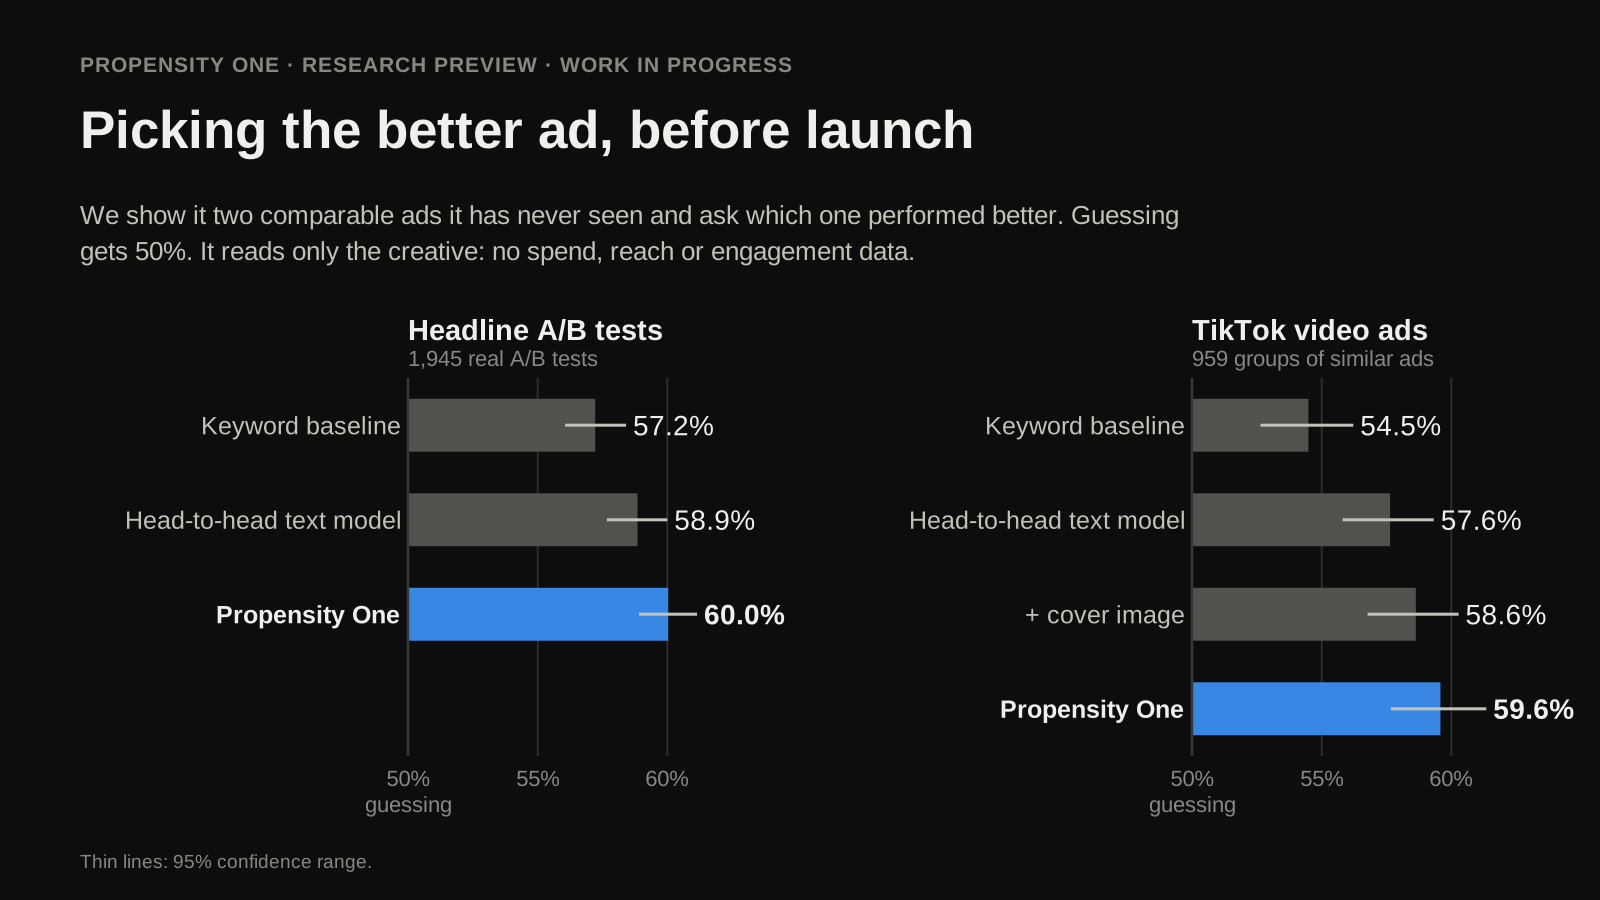
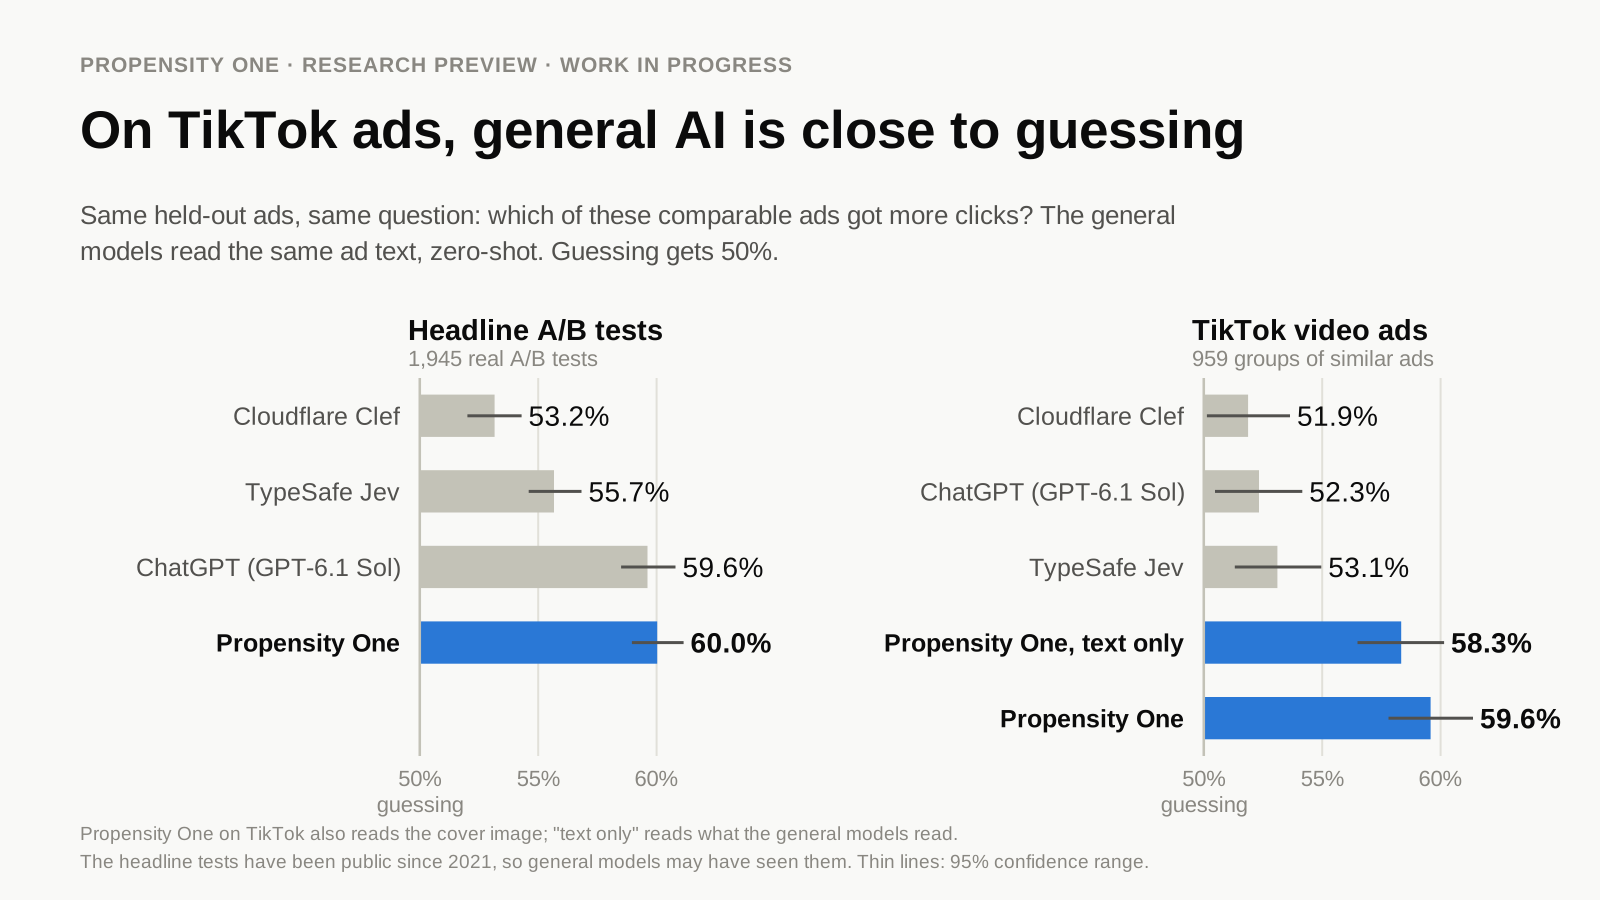
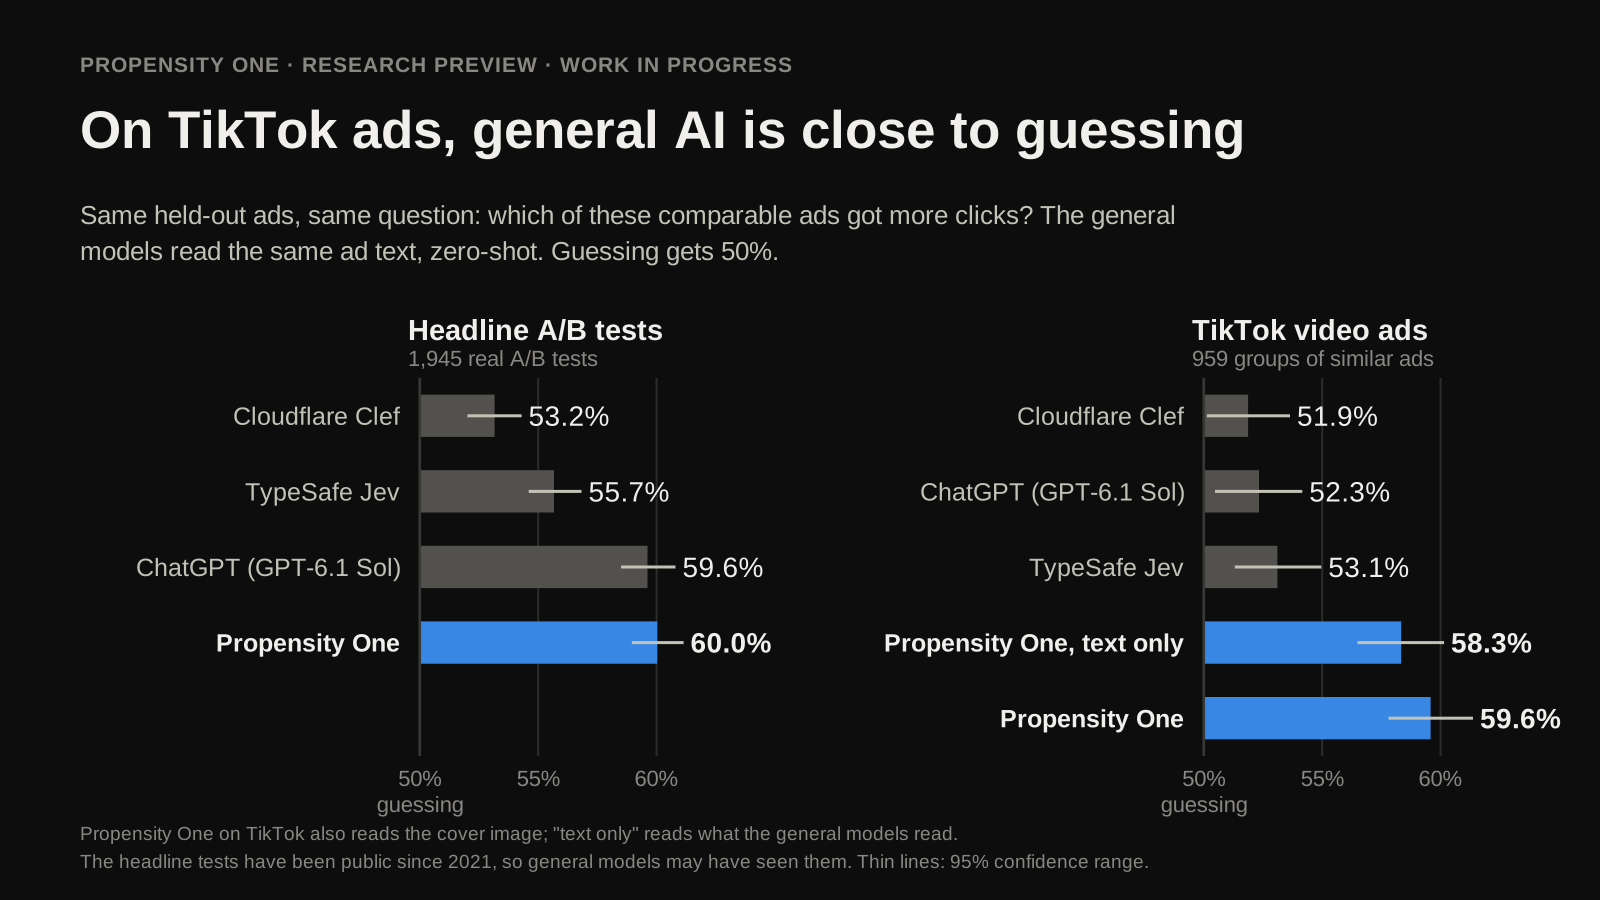
- On TikTok ads, the hypothesis holds. Propensity One orders a pair correctly 59.6% of the time. GPT-6.1 Sol, TypeSafe Jev and Cloudflare Clef score 52–53%, barely above a coin toss. The gap to GPT-6.1 Sol is +7.3 points (p < 0.0001).
- On public headline A/B tests, it’s a draw. Propensity One 60.0%, GPT-6.1 Sol 59.6%. That data has been public since 2021, so GPT may have seen the answers.
- The first fine-tune failed outright. Fine-tuning alone didn’t win. What won was training on the exact comparison the model is asked to make, then stacking it with two very plain linear models.
- Trained on free Kaggle T4 GPUs. The lite version runs in your browser.
The Hypothesis
Most of what enterprises ask of AI isn’t creative work. It’s a decision: approve or escalate, route here or there, ship version A or version B. I’ve argued before that this traffic belongs in a decision plane, served by models that score options instead of writing paragraphs, like Jev.
That leaves a sharper question for anyone with a budget. When the decision is narrow, commercial, and specific to your domain, do you rent the biggest general model available, or do you build a small one of your own?
Propensity One is my attempt to answer that with numbers rather than opinions. The bet:
A small model, fine-tuned on one narrow decision, can outperform a large generic model at that decision.
To test it fairly, the decision has to be hard, it has to have real outcome data, and the evaluation has to be impossible to game.
The Decision: Which Ad Wins?
An agency testing creative before launch wants to know which of its versions will do best. One ad’s click-through rate depends on placement, budget, audience and season. Which of two versions does better in the same placement depends mostly on the creative. So the task is framed as ranking: given a set of comparable ads, order them by expected click-through rate.
The metric is pairwise accuracy, the share of pairs within a set that the model orders correctly. A coin toss scores 0.5. It’s the same metric for a 2-ad test and a 10-ad set, and it’s easy to explain to a client: “it picks the better of two versions 60% of the time.”
Propensity One predicts clicks, not purchases, and says so. I searched for open data that links ad creative to conversions and found none.
The Data
Two public sources, chosen because they have real outcomes attached to real creative:
| Dataset | What it gives | Size | Licence |
|---|---|---|---|
| Upworthy Research Archive (Matias et al., Scientific Data, 2021) | Randomised headline A/B tests with impressions and clicks per version | 19,268 tests, 85,411 headlines | CC BY 4.0 |
| TTCC, TikTok Creative Center top ads | Caption, cover image, video and a CTR percentile per ad | 59,877 ads | Research only |
Upworthy is causal: within a test, only the headline changed. TTCC is observational: spend, targeting and TikTok’s own selection all shape the CTR. So TikTok ads are only ever compared with peers from the same industry, campaign objective and spend tier, so that no model can win by spotting big budgets.
Splits are by family, not by row. The same creative appears more than once: a headline reused across tests, a dropshipping video re-posted under a new brand name. If copies land on both sides of a split, a model can simply look up the answer. Rows are grouped into families by brand, landing domain, near-duplicate text and near-identical cover images, and whole families go to one split. A final holdout is sealed: the loader refuses to read it until release.
First, I Audited My Own Numbers
Version 0.1 of this project looked rather good. Then I went looking for reasons it shouldn’t.
| What the audit found | Evidence |
|---|---|
| Duplicate ad text across “brand-disjoint” splits | 16.5% of test rows shared text with training rows; a text lookup alone beat random |
| A post-delivery field used as an input | Creative Center adds keyword_list after an ad runs. Its length tracked the label, and it carried 50% of LightGBM’s gain |
| An “audience” field that fingerprinted each ad | 22,170 distinct values across 30,008 rows |
| An “English only” filter that wasn’t | The ASCII filter let Spanish, Turkish and Indonesian through |
| Headline metrics shown without their random baseline | Random NDCG@3 was already 0.865 |
| The test set used to choose models | Every comparison had been made on test |
With the leaks closed, TF-IDF fell from 0.578 to 0.541 and LightGBM from 0.596 to 0.535. Most of v0.1’s TikTok accuracy was leakage. Everything on this page comes from the rebuilt v0.2 pipeline, where models and stack weights are chosen on validation and only reported on test.
This is the least glamorous part of the project and the most important. If you’re evaluating a vendor’s fine-tuned model, ask how its splits were built before you ask anything else.
The Bar to Beat Was a Linear Model
Before spending any GPU time, I built CPU baselines. A fine-tuned model has to beat them to justify its cost.
The strongest was contrast ridge: TF-IDF features and a ridge regression trained on targets demeaned within each comparable cell. It learns what makes an ad better than its neighbours, rather than what makes a whole cell’s ads good on average.
| Test split, pairwise accuracy | Random | Contrast ridge | TF-IDF ridge | LightGBM |
|---|---|---|---|---|
| Upworthy A/B tests (1,945 tests) | 0.503 | 0.589 | 0.572 | 0.539 |
| TikTok, spend-stratified (959 groups) | 0.493 | 0.576 | 0.545 | 0.521 |
Hold on to the 0.576. It comes back later.
What Failed: Fine-Tuning a Decision Model the Obvious Way
The first plan was the obvious one: take Laya, an off-the-shelf ModernBERT-based decision model, and fine-tune it on 109,144 TikTok and Upworthy rows. One epoch, 2.7 hours on a single Kaggle T4.
It collapsed. On the Upworthy test set every prediction fell between 0.480 and 0.483. Blanking out the headline moved the output by 0.0002. Pairwise accuracy was 0.510 on Upworthy and 0.530 on TikTok, well below the linear baseline.
The cause was the training objective. Laya’s fine-tuning API shows the model one ad at a time with an absolute “probability this ad wins”. But that probability only means something relative to the other ads in the same test. Differences between cells swamp the differences within them, so the cheapest way to minimise the loss is to predict a constant. That’s exactly what it did. Contrast ridge works for the opposite reason: it subtracts the between-cell part before learning anything.
This is the most transferable lesson in the project. Fine-tuning didn’t fail because the model was small. It failed because it was trained on a different question from the one it was being asked.
What Worked: Propensity One v0.2
The fix was to give the neural model the same comparison the evaluation makes, and to stop expecting any single model to do everything.
                Ad copy  (+ cover image, TikTok only)
                               |
          +--------------------+--------------------+
          |                    |                    |
          v                    v                    v
  +----------------+   +----------------+   +----------------+
  | ModernBERT-    |   | Contrast ridge |   | Visual ridge   |
  | large encoder  |   | TF-IDF, target |   | SigLIP2 cover  |
  | pairwise rank  |   | demeaned per   |   | embedding      |
  | loss per cell  |   | cell           |   | (TikTok only)  |
  +----------------+   +----------------+   +----------------+
          |                    |                    |
          +--------------------+--------------------+
                               |
                               v
               +-------------------------------+
               | Stack: pairwise logistic      |
               | weights, fitted on validation |
               +-------------------------------+
                               |
                               v
Score each ad, rank the set- A fine-tuned text encoder. ModernBERT-large (about 395M parameters, Apache-2.0), trained with a RankNet loss on pairs drawn from the same test or cell, plus a soft cross-entropy so outputs remain probabilities. Two epochs took 8.6 hours on one Kaggle T4.
- Contrast ridge on the ad text, the CPU baseline above.
- A visual ridge on SigLIP2 embeddings of the TikTok cover image.
The stack combines the three with weights fitted on validation only, then applied unchanged to test.
On its own, the encoder only ties contrast ridge (0.596 vs 0.589 on Upworthy, 0.568 vs 0.576 on TikTok). It earns its place because it’s wrong on different pairs, so the stack beats every member:
| Task | Propensity One | Contrast ridge | Difference, paired |
|---|---|---|---|
| Upworthy A/B tests | 0.600 | 0.589 | +0.012 [0.006, 0.018], p = 0.0004 |
| TikTok, spend-stratified | 0.596 | 0.576 | +0.019 [0.005, 0.034], p = 0.010 |
| TikTok, clearly different pairs only | 0.718 | 0.678 |
The gains are small, and they’re statistically real on both primary tasks. That’s the honest shape of progress on a hard problem.
The Benchmark: Small and Fine-Tuned vs Large and General
This is the test the hypothesis lives or dies on. Three general models, zero-shot, on exactly the same test groups:
- GPT-6.1 Sol through OpenAI’s API, at default reasoning, ranking the ads with structured output.
- TypeSafe Jev, a frontier decision model, via Cloudflare AI Gateway.
- Cloudflare Clef, a 27B multimodal decision model on Workers AI.
Each request held one group’s ads in shuffled order with the question “which got the highest click-through rate?”. Every request was answered. The general models read text only, so Propensity One’s text-only score is reported too.
| Test split, pairwise accuracy [95% CI] | Propensity One | Propensity One, text only | GPT-6.1 Sol | Jev | Clef |
|---|---|---|---|---|---|
| Upworthy A/B tests (1,945) | 0.600 [0.590, 0.611] | (same) | 0.596 [0.585, 0.608] | 0.557 | 0.532 |
| TikTok, spend-stratified (959) | 0.596 [0.578, 0.614] | 0.583 | 0.523 [0.505, 0.542] | 0.531 | 0.519 |
| TikTok, clearly different pairs | 0.718 | 0.683 | 0.553–0.572 for the three |
The Verdict on the Hypothesis
On TikTok ads: confirmed, decisively. The general models are 2–3 points above guessing. Propensity One’s text-only stack, reading exactly what they read, beats each of them by 5 to 6.5 points (all p < 0.001). The full model is ahead of GPT-6.1 Sol by +0.073 [0.046, 0.098]. Remember the 0.576 from the linear baseline? A TF-IDF ridge regression that trains on a laptop CPU beats GPT-6.1 Sol’s 0.523 on this task, and their confidence intervals don’t overlap.
On headline A/B tests: a draw, with an asterisk. GPT-6.1 Sol ties Propensity One (+0.004 [−0.010, 0.019], p = 0.56), and it’s better at naming the outright winner of a clear-cut test: 57.0% vs 49.2% top-1. Two caveats apply:
- The Upworthy archive has been public and widely studied since 2021, so its winners may well be in GPT’s training data. TikTok’s per-ad CTR ranks are far less likely to have been memorised, which makes TikTok the fairer read.
- The archive’s authors published a 2024 correction flagging tests with possible randomisation problems. With those 442 test groups removed, the result is unchanged: Propensity One 0.593, GPT-6.1 Sol 0.598, still a statistical tie.
On cost: the GPT-6.1 Sol comparison used 0.85M input and 0.28M output tokens. Jev used 1.9M input tokens (about $0.08) and Clef 1.2M (about $0.28). Propensity One’s encoder trained on Kaggle’s free tier, and the lite model scores in a browser tab at no marginal cost at all.
So the bet pays off where it matters most: on data the big models haven’t already read, in a domain with its own peculiar signal. Where the answers may be in the pre-training corpus, the frontier model holds its own.
What This Means If You’re Building Decision Models
- The objective matters more than the parameter count. The same ModernBERT backbone went from a constant output to a model that matches the best baseline and lifts the stack above it, once it was trained on the comparison it would be asked to make. Before you fine-tune, write down the exact decision and make sure the loss function asks it.
- Build the boring baseline first. A linear model on TF-IDF features came within one to two points of the final system and beat a frontier LLM on TikTok. If your fine-tuned model can’t clearly beat something you can train in minutes, it hasn’t earned its GPUs.
- Small systems beat small models. No single member of the stack wins on its own. An encoder, a ridge and a visual model, each wrong in different places, do. It’s compound engineering at the scale of a single decision.
- Audit before you celebrate. Leakage turned v0.1’s best-looking numbers into fiction. Splits by family, a sealed holdout and model selection on validation only aren’t academic niceties; they decide whether you’re shipping a model or a lookup table. See also why evals matter.
- The moat is outcome data, not model size. The general models struggled most exactly where the signal was domain-specific. A few thousand real A/B results from an agency’s own campaigns would beat every public proxy used here.
- Report honest probabilities. Calibrated log loss sits only slightly below a constant guess. The ranking signal is real, but a single prediction is a nudge, not a verdict, and the product should say so.
Limitations
- Clicks, not purchases. No open dataset links ad creative to conversions.
- Upworthy is news headlines from 2013–2015, on one site. It teaches what makes copy clickable, not what sells a product.
- TTCC is observational and licensed for research only, so the full model can’t be used commercially.
- One advertiser’s own variants are still hard. At 0.531, the “which of my five versions” score isn’t clearly above the baseline. That’s the question many agencies will ask first.
- The cover-image model mostly rewards resemblance to known creatives. It helps a returning advertiser more than a brand-new look.
- Zero-shot only. The general models weren’t given few-shot examples or tuned prompts. That’s a fair test of “rent it off the shelf”, not of everything a frontier model could be coaxed into.
- The gains are small and the p-values are uncorrected. The sealed holdout hasn’t been opened yet. These are test-split numbers from a research preview.
Try It
Propensity One lite is public under CC BY 4.0. It’s the contrast ridge trained on Upworthy only, so it can be shared, and it scores 0.589 on the Upworthy test split. The scorer was ported to JavaScript and matches the Python model to within 1e-9 on all 16,222 validation and test rows, and it runs entirely in your browser.
- Demo on Hugging Face Spaces: paste a few headline variants and see which one it would bet on.
- Model on Hugging Face: safetensors and JSON vocabularies, a Python loader, and a model card generated from the measured evaluation.
- Source on GitHub: the data pipeline, evaluation harness, baselines and training code. The repo is private for now and will be open-sourced.
The full model has no public checkpoint yet: it’s trained partly on research-only TikTok data, and the encoder run behind these numbers didn’t save its weights.
What’s Next
- Re-run the encoder with weights saved (about 9 GPU-hours), once for the full model and once on Upworthy only, for a stronger public release.
- Finish video extraction. About 44% of TikTok videos are processed so far, and there’s no sign yet that video adds anything over the cover image.
- Try a decoder LLM scorer (Qwen3.5 with LoRA) as another member of the stack.
- Open the sealed holdout once, at release, and publish whatever it says.
- Partner outcome data. The commercial version needs real A/B results, ideally with conversions, from agencies willing to share them.
A full paper-length write-up is in preparation for arXiv.
Frequently Asked Questions
Isn’t 60% barely better than a coin toss?
On noisy pairs, yes, and that’s the nature of the problem: many ads in a set differ by noise, not by quality. On TikTok pairs whose CTR percentiles are 25+ points apart, Propensity One gets 71.8% right, against 55–57% for the general models. The skill shows up where there’s a real difference to find, which is exactly where a pre-launch decision matters.
Why not just fine-tune a frontier model instead?
That’s next on the list, in miniature: a Qwen3.5 LoRA scorer as another member of the stack. The Laya result is the warning, though. A bigger model trained on the wrong objective will learn the wrong thing more expensively. The objective is the first decision; the model size comes second.
Could GPT-6.1 Sol do better with a cleverer prompt?
Possibly. This was a zero-shot test with a plain question, which is how most teams would first try “just ask the LLM”. Few-shot prompting or retrieval over past winners might narrow the TikTok gap. They would also start turning the general model into a narrow one, which is rather the point.
Can I use Propensity One commercially?
The lite model, yes: it’s trained only on CC BY 4.0 data and released under CC BY 4.0, with attribution. The full v0.2 model, no: part of its training data is licensed for research only. A commercial version would be trained on licensed or partner-supplied outcome data.